
Earlier this month I attended ArcGIS Pro desktop training at AlphaGIS to learn more about professional mapping and geoanalytics. I was excited to explore this new path to see, how it could be applied to mapping work as well as get more insight into this interesting field I have worked parallel for the past four years. After three-day intensive on-site training, I signed up for ArcGIS Pro 21-day trial to see how it could be applied to Greenground Maps. This was mainly for evaluation and learning purposes, but I can also use the final work as a base for future maps, so there is also a practical outcome.
I first signed up online and managed to use up my credits at once by running a walking distance analysis for 400 points. Turned out replacing them would cost hundreds, so I just registered a new account and started again. I was quite excited to install the desktop version, but after hitting the download button, I discovered ArcGIS only works in Windows. So instead of using my 2013 Mac I usually work with, I had to open up my even older Acer I used when I was travelling. Not a great start, but I was determined to give it a go. Software installed I set to work with the snail pace as Acer had to think through every move I made. Nevertheless, it worked and I set about to create my first map!
I soon found out that running a base-map was not an option for me, if I wanted to achieve any progress, so I switched it off to save memory. Luckily Greenground Maps don’t have base maps anyway. I copied my data points to My Google Maps to prepare a KML file with coordinates, discovering soon Google doesn’t include any with the file (apparently you need Google API as they protect their own data). After some research online, I found and ran a geocode app through 800 data points in Google Sheets but failed to click on a box somewhere and had to wait for the next day to do it again (as large geo datasets cannot be processed several times in a day).
Once I had my coordinates in I set about importing them to ArcGIS. I used XYTableToPoint and like magic, all my points popped up on the map (albeit few of them in the wrong locations). With some fiddling I also got in the park labels. Hooray! As I was interested to see, if I could improve the walking matrix based on distance I was curious to try the Generate Near Analysis to connect the nearest points. When I finished it with XYtoLine I was impressed with how it turned out! I could really see the benefit of running through a large set of data with a click of a button. This was a good days work.

Later in the week I also added some open OS green space and watercourse data and after I included those Acer decided it was just too much to handle and crashed. So afterwards I kept both layers mostly off, if I didn’t need to work with them.
Next I downloaded GPX walking paths from various open internet sources and included them with the GPXtoFeatures tool. Once they were in I used customise to colour them according to the index. A simple and straightforward task for a change. Some of my lines are rivers, so I used Select & Layer from the selection feature to select waterways from the OS watercourse layer. It seemed like a good solution but backfired later as it turned out this feature is not supported for online sharing. Few of the processes in ArcGIS are not self-evident and you just have to find out in a hard way.
I used the same Layer method to select the data points I wanted to separate and colour according to lines and initially, it worked out fine, but I ran into a problem when some of the errand points in the wrong layers didn’t copy over no matter how hard I tried. This was the first problem I couldn’t solve myself (after hitting the credit wall in the early days of the trial), so I got in touch with AlphaGIS support and was patiently walked through a better solution just before six o’clock on Friday evening. I spent rest of the evening reworking the points with definition query and customised them with different colours.
Next week with newfound enthusiasm, I set to work to copy and sort my errand data points, which now seemed like a straightforward job with the Move To tool. Except, after I had successfully sorted the main lines and started to work on doubles and outer edges I found the following morning half the day’s work was gone because I hadn’t used the correct save button! Apparently Edit tab has its separate save button and hitting the main save will only save the project settings. This wasn’t a problem as long as I had closed the program properly (as it asked to save the changes), but I had accidentally pulled the cord.
Once I had corrected my points the second time (both on map and in the table) I was ready to export some layouts for print! I used definition query to limit the green spaces from tens of thousands to couple of thousands, switched on all the layers and did an hour of grocery shopping as Acer puzzled over the final file. By the end of the day I had an actual map I could print out or pull into graphic software and use as a base for a new map.

As I was now coming to the the end of the trial I set up to export the map online. After pre-publishing analysis three severe errors and one medium error popped up and required immediate attention or the map couldn’t be published. I had to go back and merge the selected layers made from waterways, which cleared one of the error as well as delete couple of redundant tables and switch on a box in properties. Once I published the map, opening it up in ArcGIS online was straightforward, but my colour coded definition query points did not come out in separate layers as I had hoped.
—
In conclusion, I’m not sure the whole process is quicker than my usual method working with Google Maps, but when it comes to data selection and analysis, ArcGIS finds and processes information quicker & keeps data rooted with more integrity. It’s also fun to run the analytics and I really enjoyed the problem-solving and some of the robust data tools. However, it’s hidden pricing policy, counterintuitive UI and non-compatibility with Mac makes me also want to consider open-source alternatives for independent mapping work.
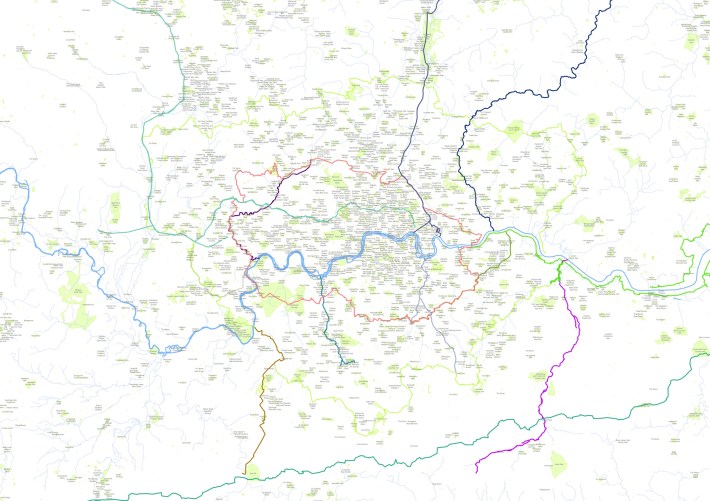
The final map includes layers with OS Open Greenspace and OS Open Rivers information, GPX trails from various open online sources, 800+ parks and open spaces from the 2021 London Greenground map and London Boroughs from TFL Open Data Hub.
The ArcGIS Pro training at AlphaGIS was supported by the Estonian Unemployment Insurance Fund
